Despite all of the funny commercials on television and price wars being waged by property and casualty (P&C) providers to attract new customers, the claims process is one of the most critical experiences a current policyholder has with an insurance company. It’s a time when customers are vulnerable and look to the company to be a trusted advisor and expert. Depending on how the experience goes, it can make or break a relationship.
It’s well known that a positive experience is likely to drive a high customer satisfaction (CSAT) score or Net Promoter Score (NPS). But when you look at the claims experience, there are many variables that work together to make up the experience—from how policyholders are treated to the different process steps and channel interactions. The TeleTech P&C Customer Satisfaction Survey set out to determine what really drives satisfaction using a new set of analytical tools that help decode the secrets to a great claims process.
Satisfaction comes from a cohesive experience
As part of our P&C Customer Satisfaction Survey, more than 300 consumers were asked about how the claims process influences customer satisfaction. We learned that multiple factors are involved, including how policyholders were treated, the claims process, channel interactions, etc. We also learned that these factors are not isolated. They work together as a coalition to drive customer satisfaction.
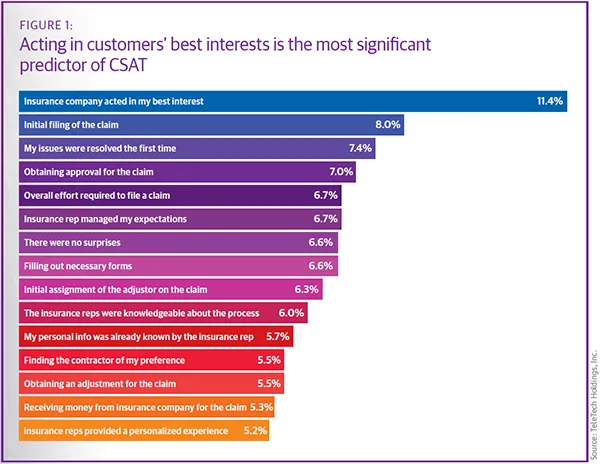
Looking at more than 30 attributes of the claims experience, the research found that both relationship and competence factors influenced satisfaction. The most influential was “my insurance company acted in my best interest.” Figure 1 shows the list of significant satisfaction drivers, by order of influence.
It’s important to emphasize that customer satisfaction is not just predicated on singular drivers. It is influenced by a coalition of variables that act together. The mix of relationship factors with tools and processes have an impact on overall satisfaction. So while “acting in a customer’s best interest” was the most influential factor, each one of the significant drivers in Figure 1 builds on one another. Just improving one variable may not be the best approach—it’s a complex ecosystem with highly correlated variables that must be viewed holistically.
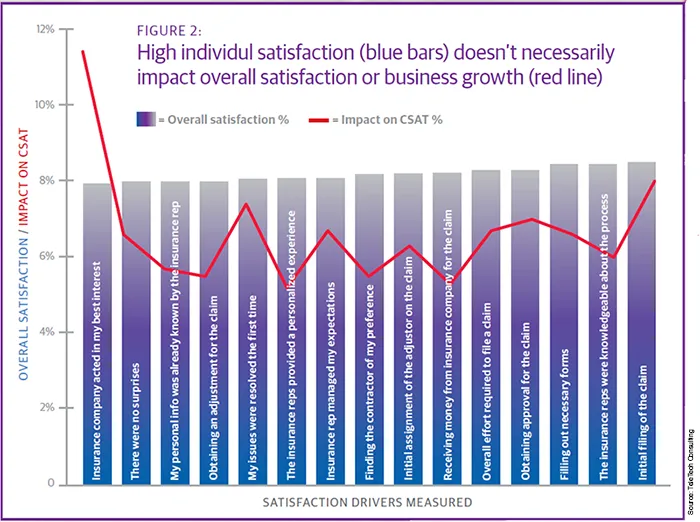
What we also found was that satisfaction on its own doesn’t necessarily drive business results. The item “the insurance company acted in my best interest” was by far the most important predictor of overall satisfaction. But looking at average current satisfaction levels, it ranks much lower than the claim filing process and knowledgeable reps (see Figure 2). This shows that the things people are less happy with are sometimes the most important to focus on for future success.
So where should businesses focus their efforts? Figure 3 further categorizes each driver into one of four quadrants, combining both sets of satisfaction measurements. This provides an insightful way of looking at the results that can help insurance firms prioritize where to focus their customer experience efforts. Quadrant I, which has items with above average impact on overall CSAT and below average item satisfaction (i.e., greatest opportunity for improvement), should be prioritized first. Quadrant II items should be prioritized second, because of their high impact on satisfaction levels. Quadrants III and IV (especially IV) should be deprioritized, since improvements in those areas won’t drive major change in satisfaction or NPS.
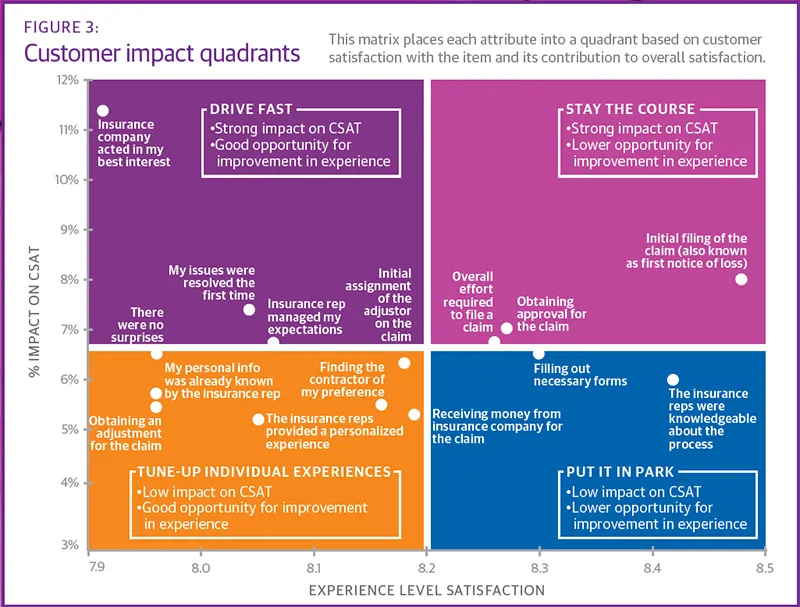
The research confirms the notion that customer experience is a coalition of many factors, which require sophisticated analysis and a strategic approach when making improvements. In addition, this advanced level of analysis gives executives the tools to fight heuristics or intuition. For example, fixing the five lowest ranking satisfaction areas seems like a good idea, but the data show that it isn’t necessarily the right approach to see real improvements in overall satisfaction.
Channel metrics reveal experiential insights
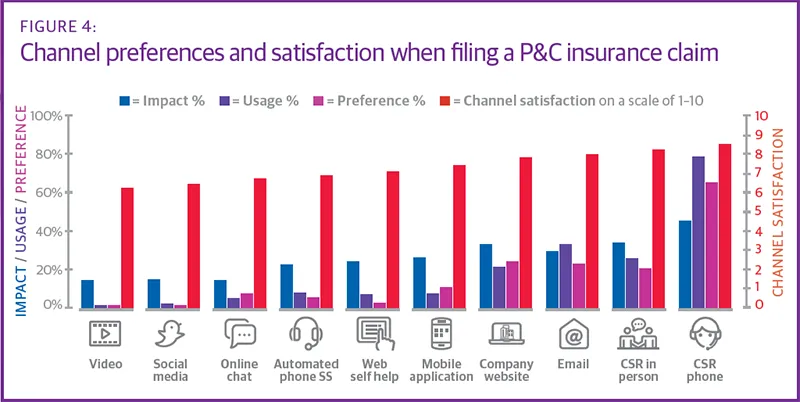
We found that channel-specific satisfaction is important to overall satisfaction. So it’s important that companies focus on what channels their policyholders like and make sure that they provide a good experience in those channels.
By far the most used channel was phone. Eighty-nine percent of respondents talked to a representative over the phone or in person for their last claim (see Figure 4). The phone channel also had the highest channel satisfaction rate and impact on overall satisfaction. This was followed by speaking to a rep in person, and then using the website, mobile app, and self-service.
Channels that were preferred by respondents (and used more often) were also the channels for which channel satisfaction had a bigger impact on overall satisfaction (see Figure 5). Quadrants were determined by plotting the impact on overall satisfaction (X axis) and preference (Y axis).
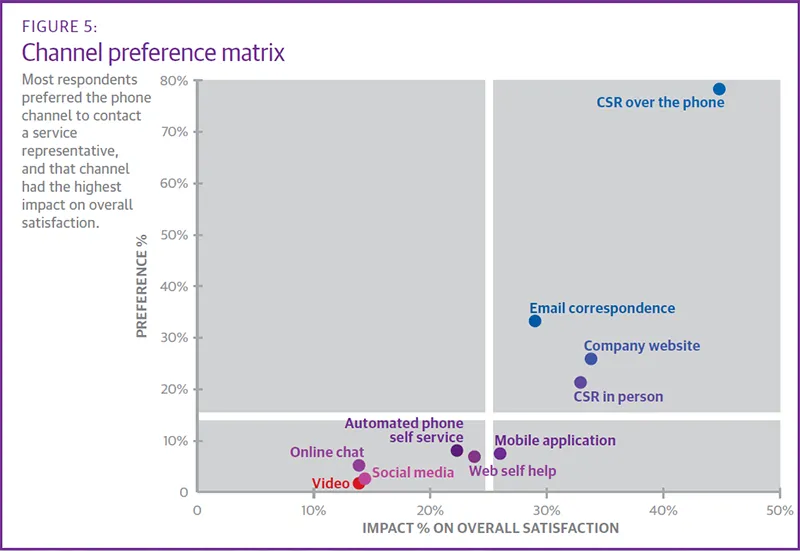
We also looked more closely at chat, since it’s a growth channel for a number of insurance carriers. The research found that respondents who used chat all used some other form of communication along with it. They were also less likely to use the phone, but more likely to use all other channel options when compared to respondents who did not use chat. Based on this data, it becomes clear that a cohesive omnichannel experience is critical.
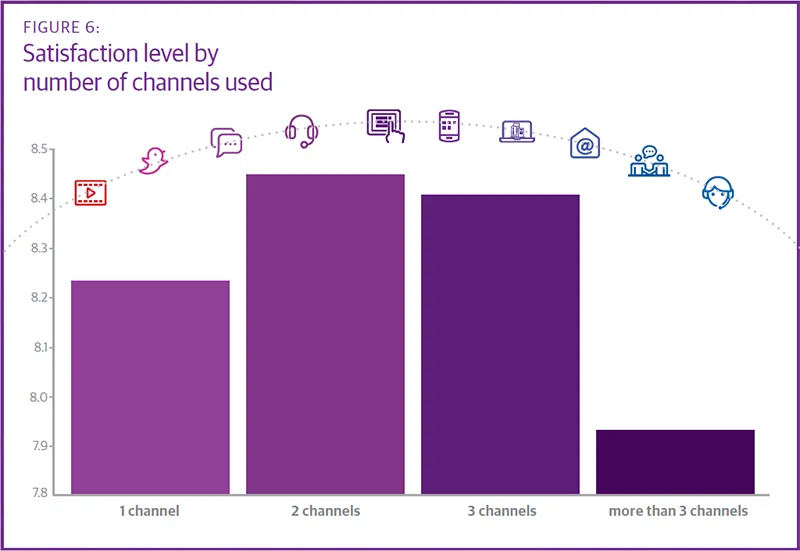
Another interesting finding is that there was a slight increase in satisfaction when policyholders went from using one to two channels (chat plus something else, for example). Then there was a substantial drop in overall satisfaction for the claims process when using three or more channels (see Figure 6). It can be implied that if policyholders did not resolve their issues through the first two channels, they had to find other ways of reaching a service rep, which therefore negatively impacted their satisfaction level.
Best practices to deliver a superior P&C customer experience
The data shows that understanding your policyholders and acting in their best interests are critical to delivering the best experience possible throughout the claims process. In addition, customer care representatives have enormous potential to influence customer satisfaction and loyalty, as well as company growth by how they work with customers during this important time. Therefore, we recommend the following best practices to optimize customer experience:
• Focus your analysis on specific points in the customer journey to ensure a clear and actionable set of results, such as the claims process.
• Prioritize the key areas that have a high impact on CSAT and provide a good opportunity for improvement in the customer experience.
• Implement people, process, and technology improvements for the key areas determined.
• Educate the organization on how each area of the business impacts the customer experience.
• Continually monitor success and make adjustments where necessary.
Conclusion
Because the claims process is such a critical event in the life of a P&C insurance policyholder, it’s paramount that insurance providers get it right. They need to use new methods of analyzing customer data to understand not only what has the most impact in driving satisfaction, but also where to focus to improve customer satisfaction. By truly understanding the customer experience and key drivers, providers can be more effective at improving the customer experience and increasing customer retention. The TeleTech P&C Customer Satisfaction Survey breaks down what really satisfies customers and leads to promoters. Todays’ CX improvements lead to better customer retention and tomorrow’s business growth.
*Note: Andrew Vranesic and Carrie Thomas contributed to this article. Analysis conducted by Gunnar Schrah and Anthony Pascoe.

